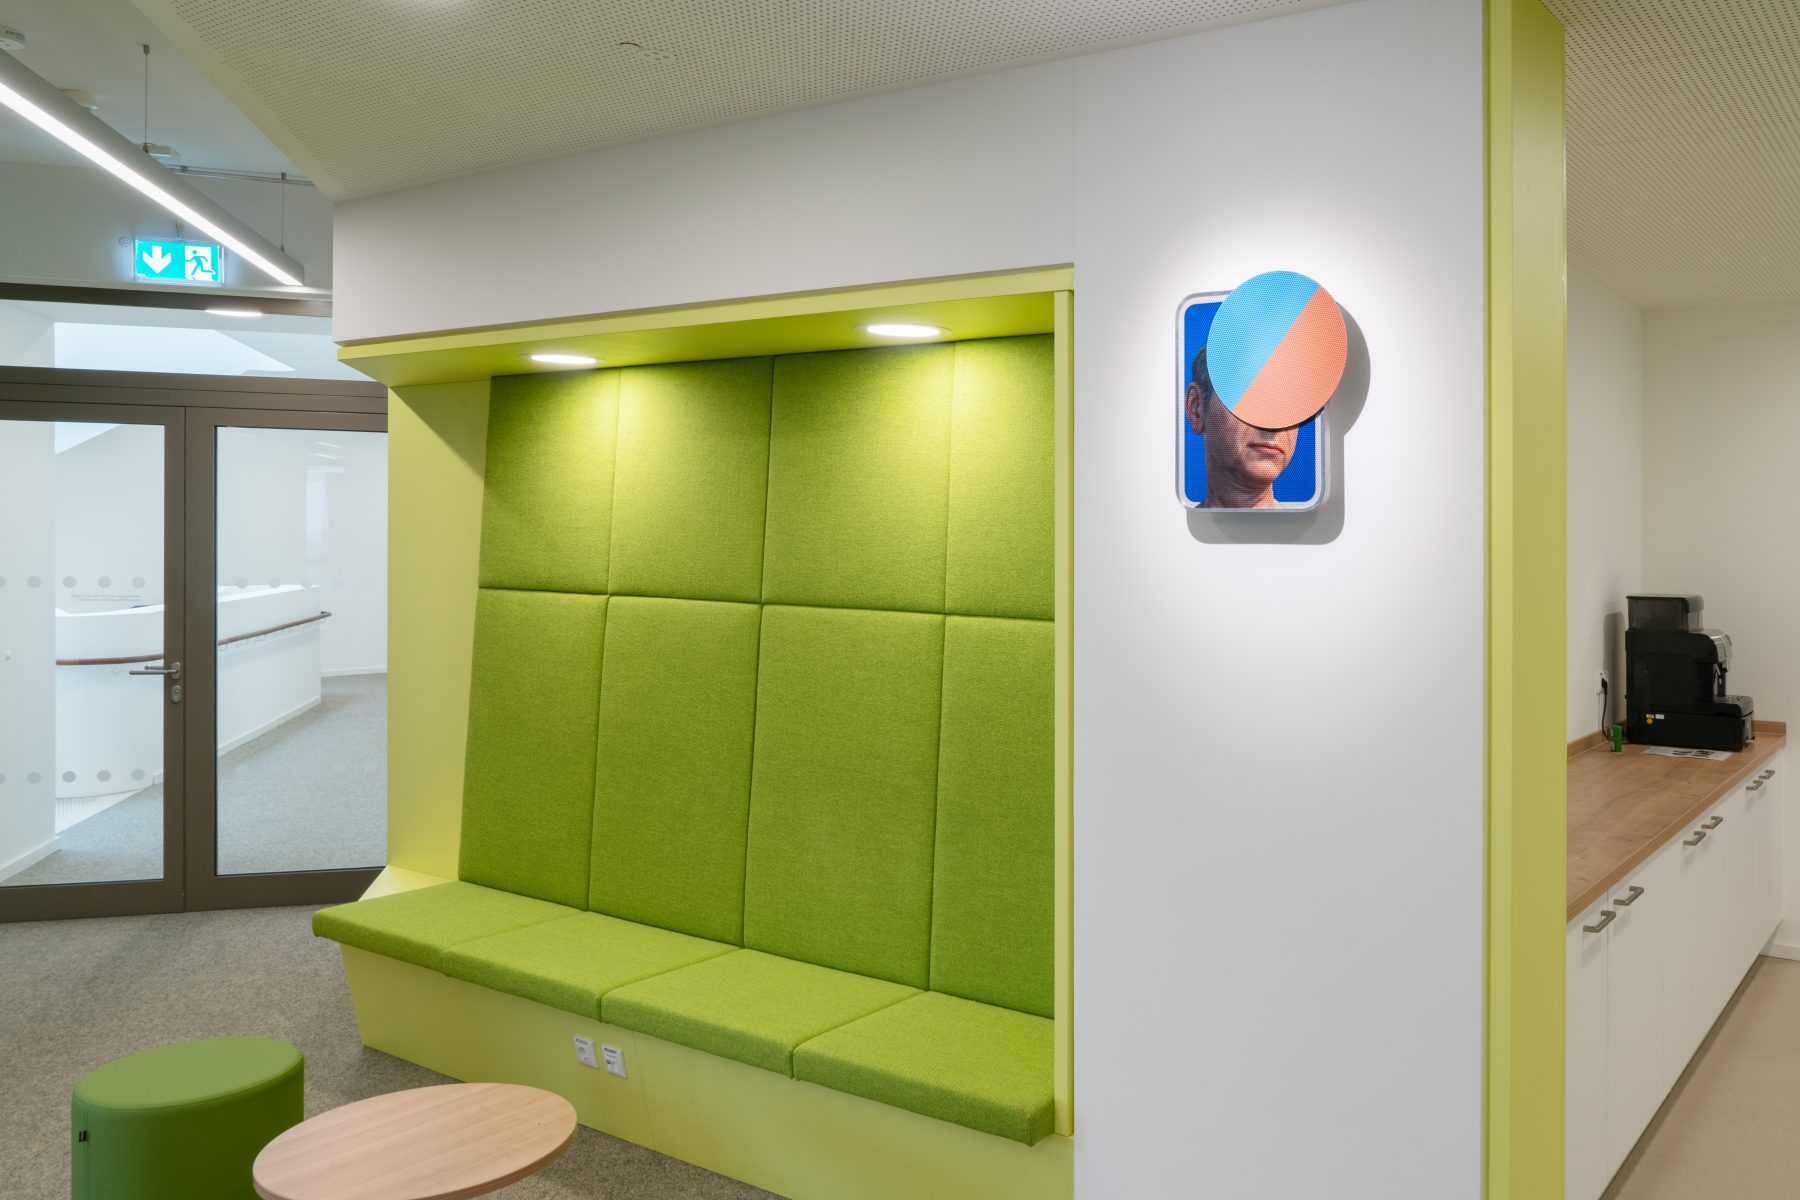
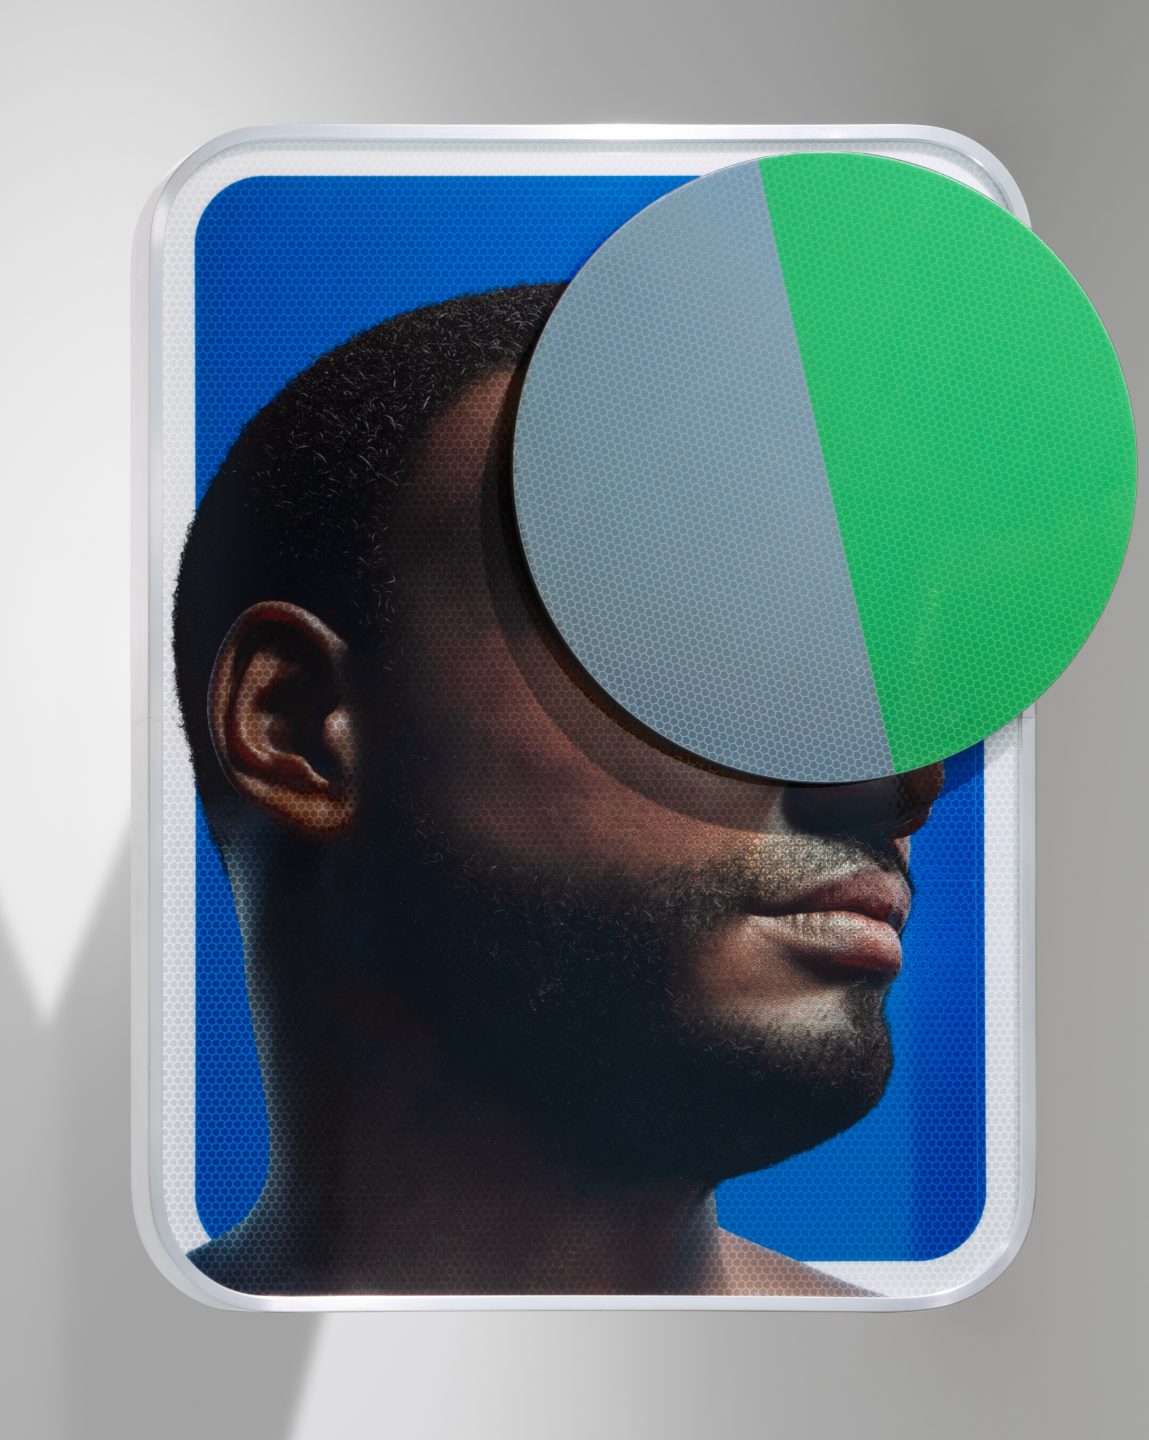
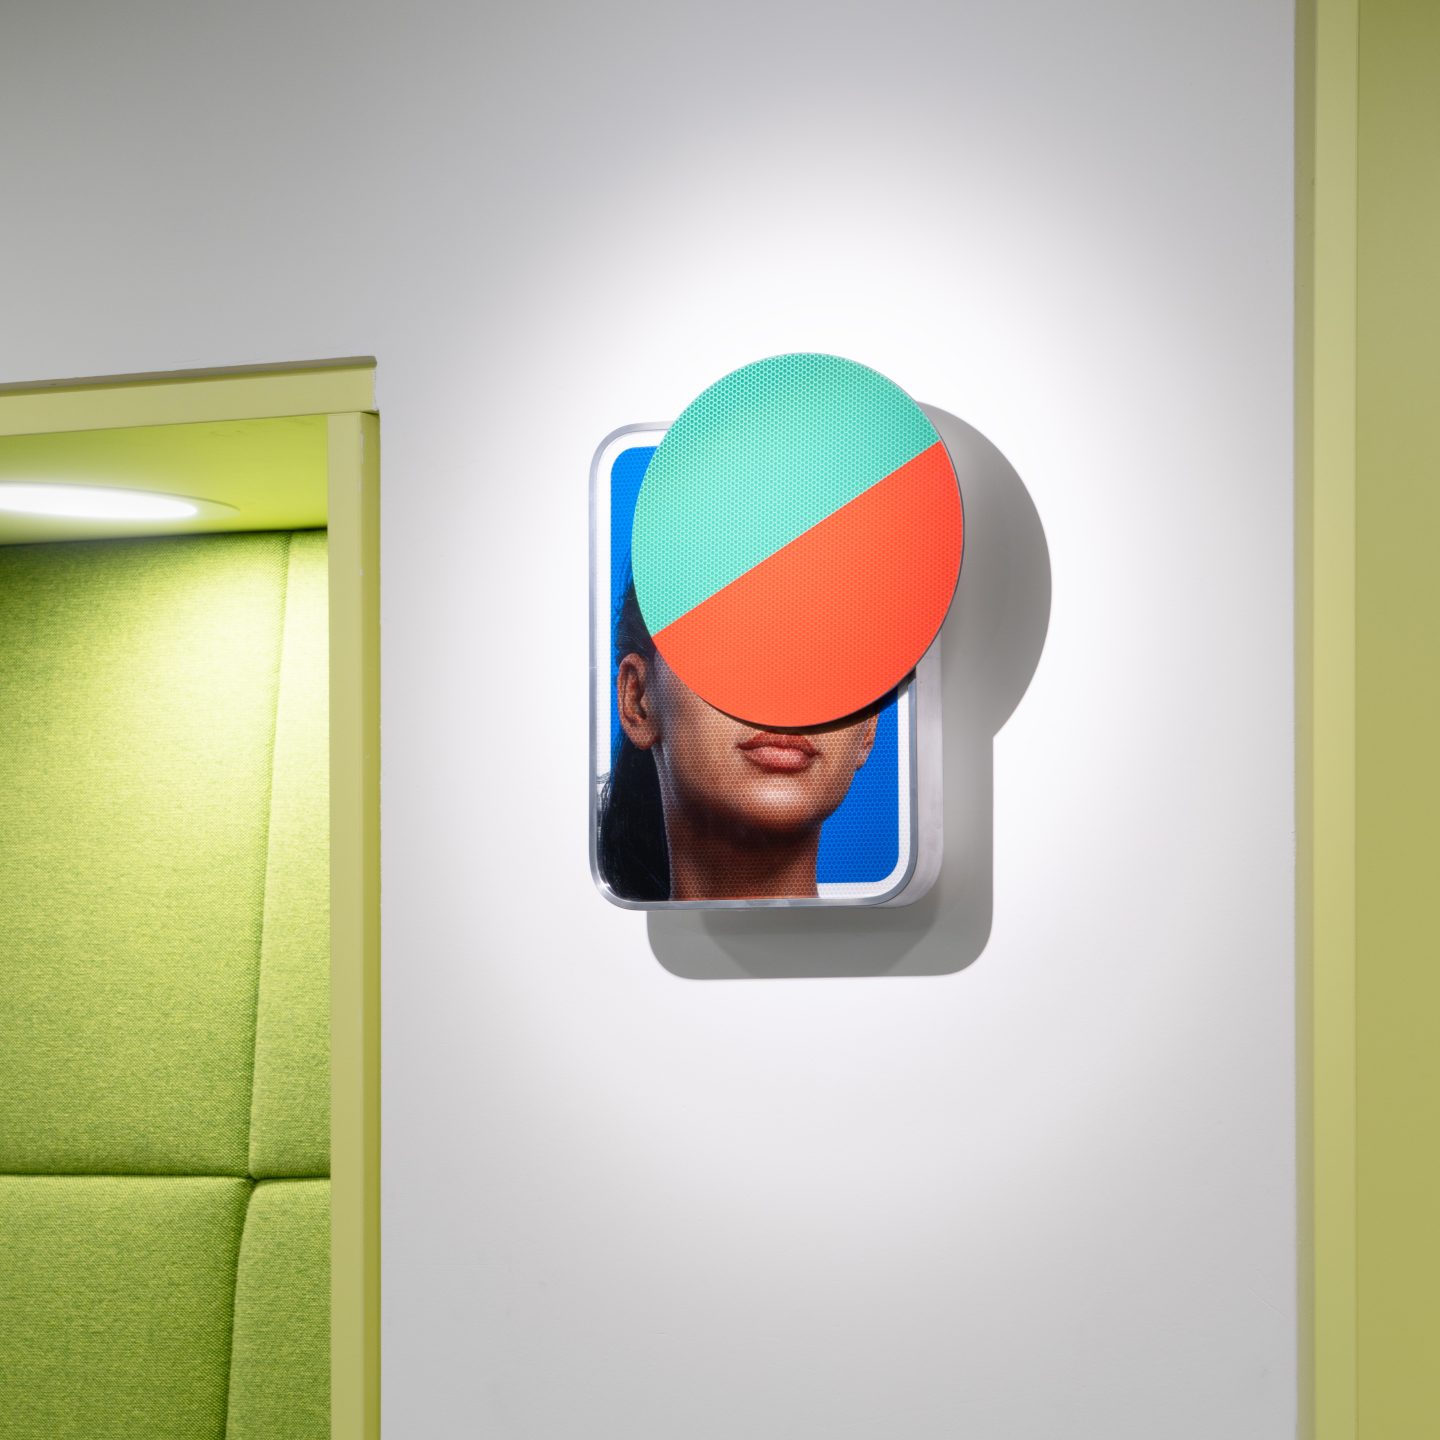
Doubts
2023, traffic signs, rotating circles, 45×35cm
For months, I’ve been waiting for the experiment to end. Will my hypothesis be correct? I can’t wait to analyze the results.
As I enter the room, I feel my hands slightly sweating. I take a deep breath to calm myself. I glance at the analysis station. The data collection has been running for hours, but there’s nothing visible from the outside. However, there’s a progress bar slowly filling up on the monitor. 98.7% done. Finally, we have a new analysis script that actually shows something.
Now the bar is at 100%. The standard deviation of the first data points is surprisingly small, but the trend doesn’t make sense. Was there a configuration error? We’ve had that before. Or maybe it’s just the new cathode. It often behaves differently than expected. I have no idea if this is better or worse in real-world application. It’s already late, better to continue with a fresh mind tomorrow.
Before leaving, I start the process again, this time with the old version of the script. Better safe than sorry. On the way out, I see the hourglass on the screen. The familiar image. Once again, without a percentage display. I turn off the lights.
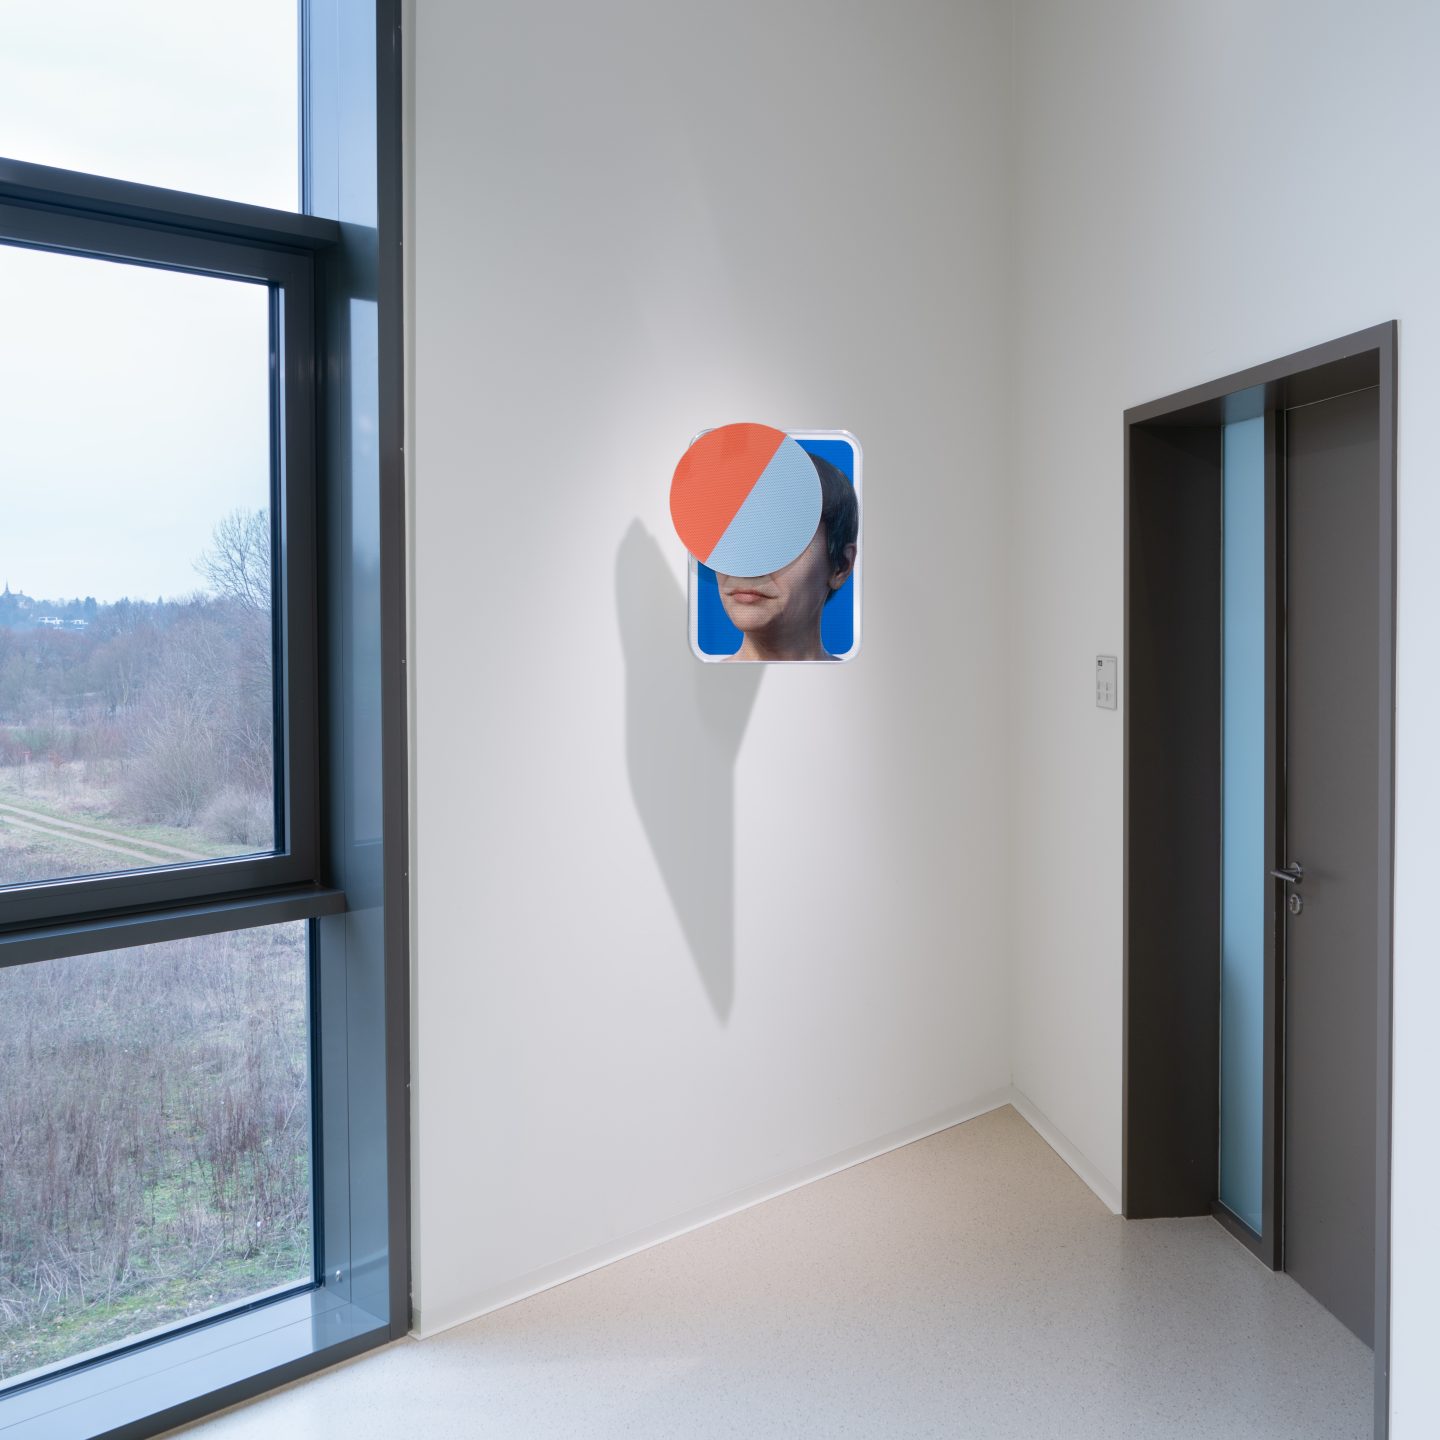
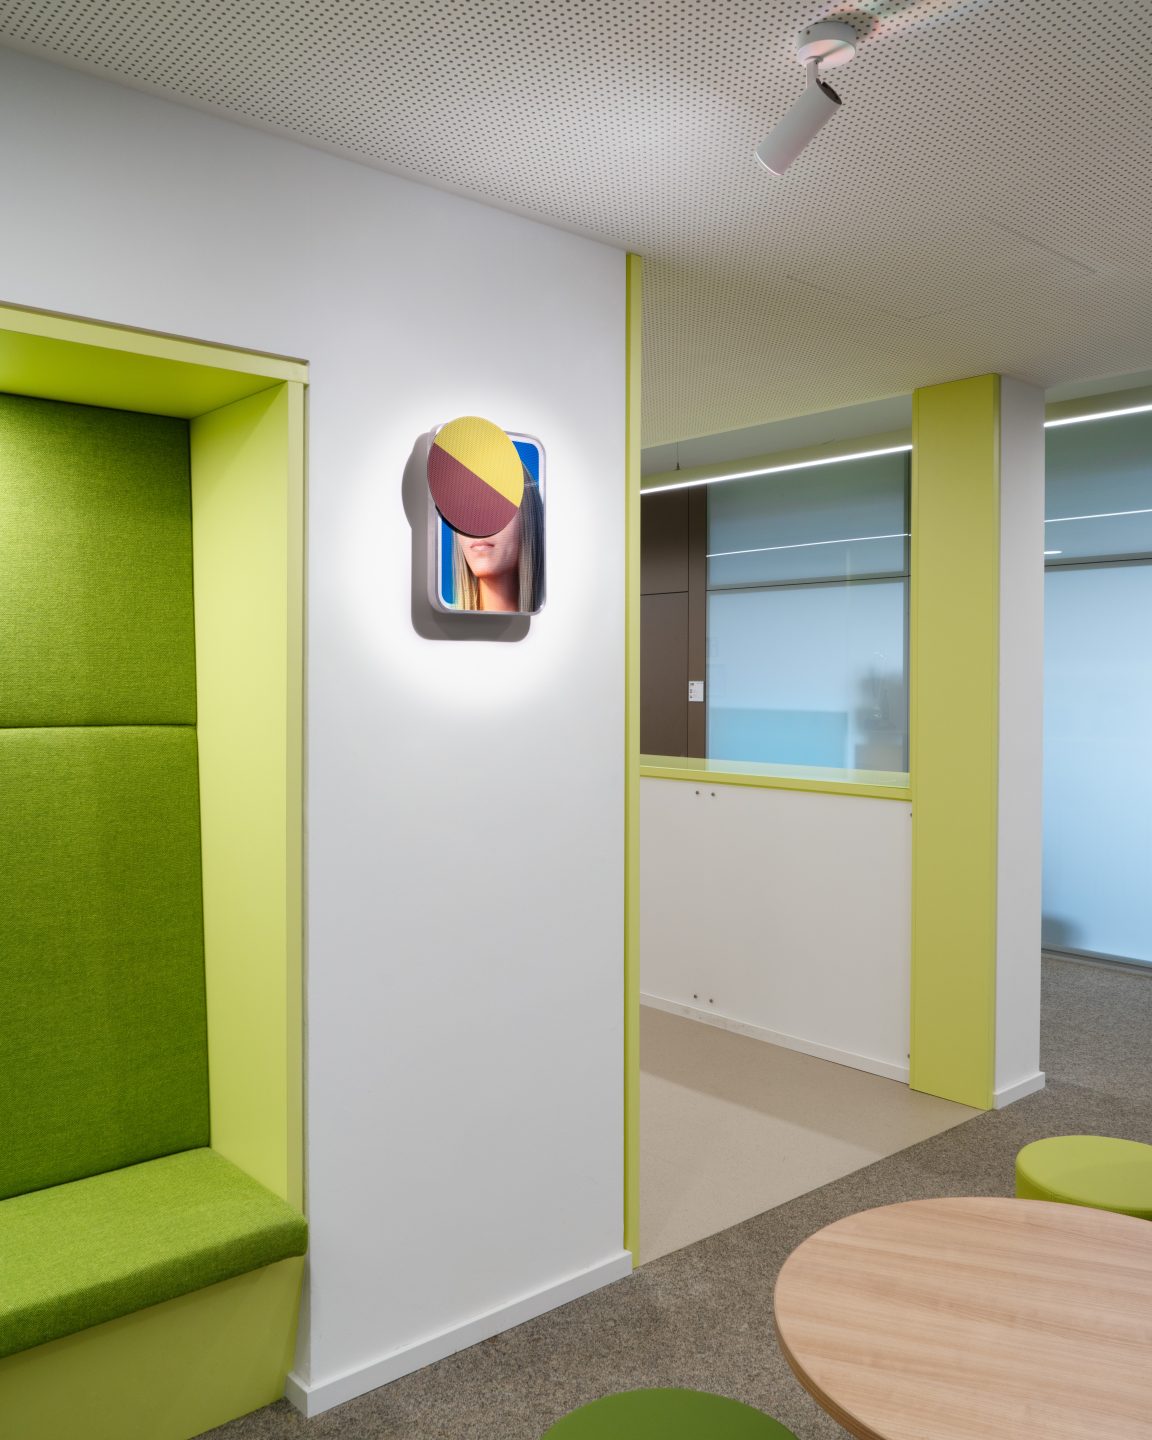
Installed in the CARL research center at the RWTH Aachen. Outside the building is the installation Processes.